


Futuristic basketball infographic graphic
Prompt
futuristic comic book infography about basketball. --ar 16:9


 Download Image (SD)
 Download Image (HD)
Share


License
Free to use with a link to 2moonsai.com

Similar Images
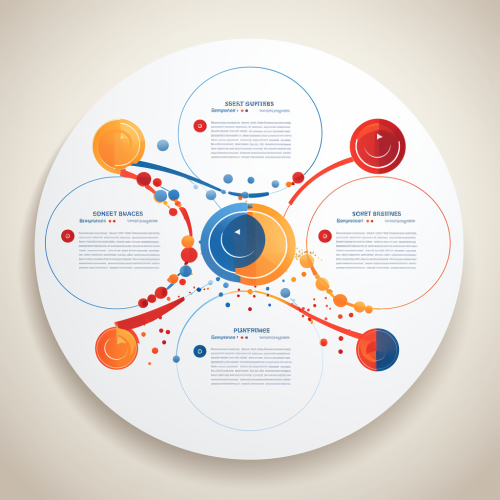
a simple circle infographic design with three pillars in the style of designer Carlos Simpson

basketball fan cheering facing camera, holographic Aztec effects, photorealistic, fuji film, 35mm --ar 16:9
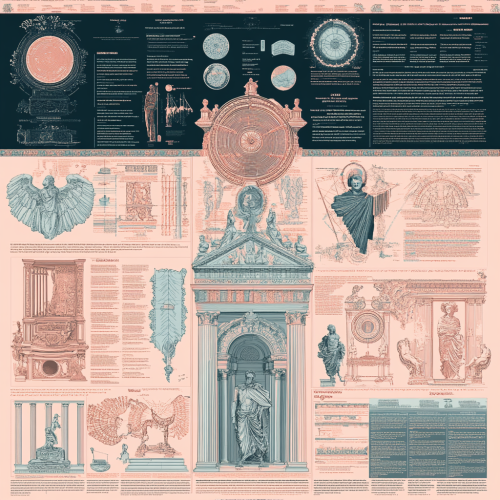
infographic about art cycles during the ages. The artwork features multiple panels that showcase detailed line work of different artists and cultures, scales, and other intricate details. Aesthetic combines classical serenity with dynamic data chaos, illustrating tradition meeting innovation. The page is filled with one main object and around it there are additional detailes about it. Colorful. Color palette pink and cyan --v 6.1 --style raw

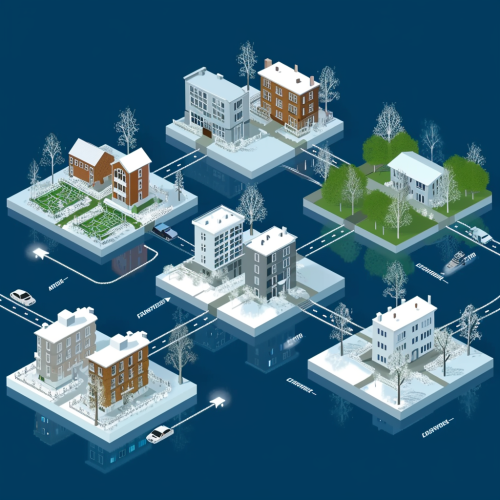
isometric view of urban design. Infographic. --style raw --v 6.0 --weird 3000
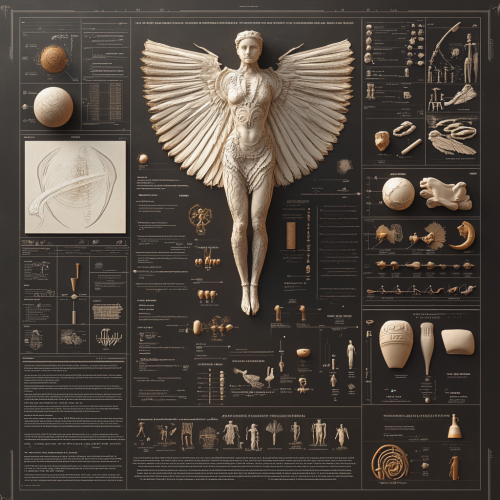
Creative infographic of art in prehistoric age. The page is filled with one main object and around it there are multiple panels that showcase detailed line work of different artists and cultures, scales, and other intricate details. Aesthetic combines classical serenity with dynamic data chaos, illustrating tradition meeting innovation. Contrast, richness in detail. 3D render, octane, cinema4d --v 6.1 --style raw
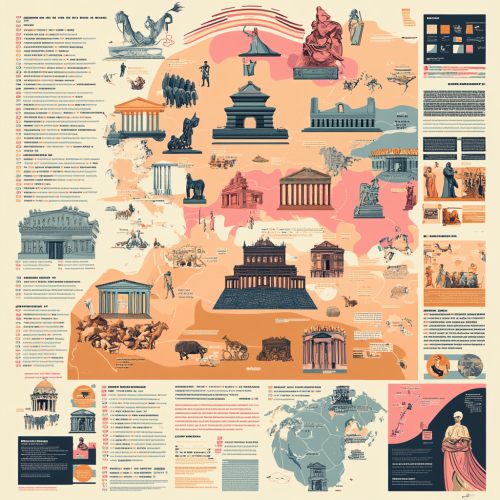
Illustrated map-like infographic highlighting the rise and fall of major civilizations (e.g., Ancient Greece, Roman Empire, Chinese dynasties), social/political movements (e.g., revolutions, reforms), and the evolution of cultural practices (e.g., art, music, literature), using a rich, historical color palette. Include stylized icons, timelines, and regional illustrations. The page is filled with one main object and additional details around it. Color palette of pink, orange and blue --v 6.1 --style raw

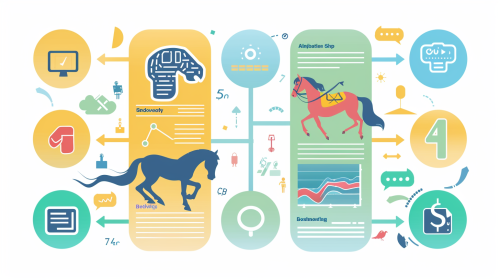
A flat modern infographic showing all four steps of the automatic horse betting purchase process. Step 1: AI brain processes horse racing data. Step 2: CSV file export with racing symbols. Step 3: Data is uploaded to an automated trading system via a computer or cloud. Step 4: Automatic horse betting ticket with a checkmark. Each step is connected by bold arrows from left to right. Light pastel colors (blue, green, yellow) with clear icons, minimalistic yet detailed design, professional layout, hd quality --ar 16:9 --v 6.0

a montage of laker vs celtic basketball games, set in the year 2080, through a wide lens, cinematic, noir lighting, 8K --ar 16:9
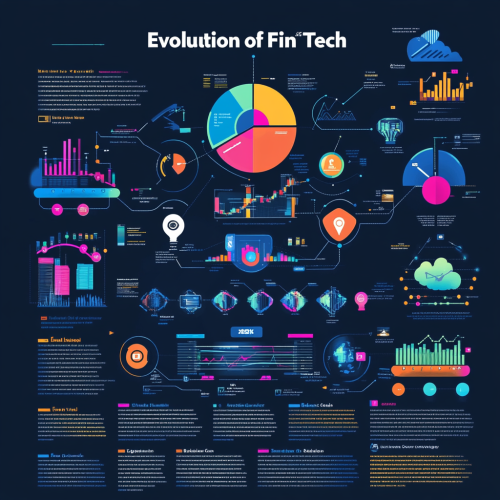
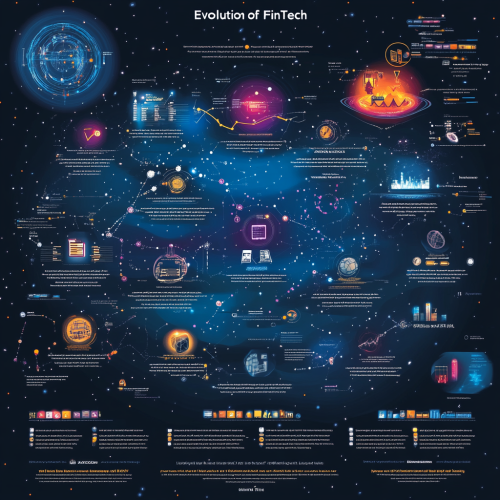
Design a captivating infographic titled "Evolution of FinTech" using a techno style and modern color palette. Infographic Structure: Timeline: Visually represent the evolution of FinTech over time, starting from its early origins to the present day. Key Milestones: Highlight significant milestones and innovations, such as the introduction of ATMs, online banking, mobile payments, blockchain technology, and artificial intelligence in finance. Impact on Financial Services: Showcase how FinTech has disrupted and transformed various financial sectors, including banking, payments, lending, investing, and insurance. Emerging Trends: Highlight the latest trends and technologies shaping the future of FinTech, such as decentralized finance (DeFi), open banking, and embedded finance. Benefits and Challenges: Illustrate the advantages and disadvantages of FinTech adoption for both consumers and businesses. Visual Style: Techno Style: Employ a futuristic and tech-inspired aesthetic, with sleek lines, geometric shapes, and vibrant colors. Modern Color Palette: Use a combination of bold and contrasting colors, such as electric blue, neon green, vibrant orange, and deep purple. Dynamic Illustrations: Incorporate eye-catching illustrations and icons to represent key FinTech innovations and concepts. Data Visualization: Use charts, graphs, and other visual elements to present data and statistics effectively. Overall Tone: Informative and Engaging: Present the information in a clear, concise, and easily understandable manner. Visually Appealing: Utilize a modern and visually stimulating design to capture the essence of the FinTech revolution. Forward-Looking: Highlight the transformative potential of FinTech and its impact on the future of finance.
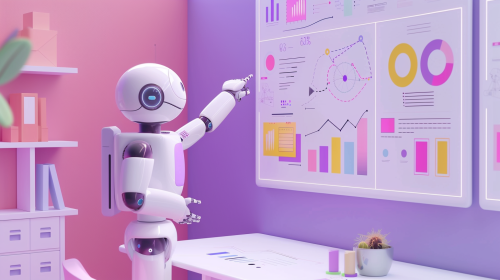
Classroom scene with an AI robot presenting information, pointing towards a board filled with colorful charts and flow diagrams. The design is modern, flat, and infographic-style, with pastel tones (white, purple, pink, yellow) for a friendly yet informative feel. The layout is simple and emphasizes clarity, with minimal isometric elements for a touch of depth, hd quality, educational vibe --ar 16:9 --v 6.0

View Limit Reached
Upgrade for premium prompts, full browsing, unlimited bookmarks, and more.
Get Premium
Limit Reached
Upgrade for premium prompts, full browsing, unlimited bookmarks, and more. Create up to 2000 AI images and download up to 3000 monthly
Get Premium
Become a member
Sign up to download HD images, copy & bookmark prompts.
It's absolutely FREE
 Login or Signup with Google
Become a member
Sign up to download HD images, copy & bookmark prompts.
It's absolutely FREE
Login or Signup with Google
Limit Reached
Upgrade for premium prompts, full browsing, unlimited bookmarks, and more.
Get Premium